Better Data. Smarter Clinical Outcomes.
Recursis helps clinical study teams organize, capture and structure high-value data at enrollment so every downstream analysis is faster and more visually insightful.

Unclean Enrollment Data Slows Studies and Hides Risk
In every therapeutic area, study success is shaped at the moment of patient enrollment. Yet key data, like prior therapies, diagnostic markers, comorbidities, and protocol eligibility, is often fragmented, delayed, or missing.
-
Manual data cleaning wastes time and resources
-
Protocol deviations aren’t caught early
-
Subgroup and stratified analyses are delayed
-
Regulatory reporting suffers from incomplete baselines
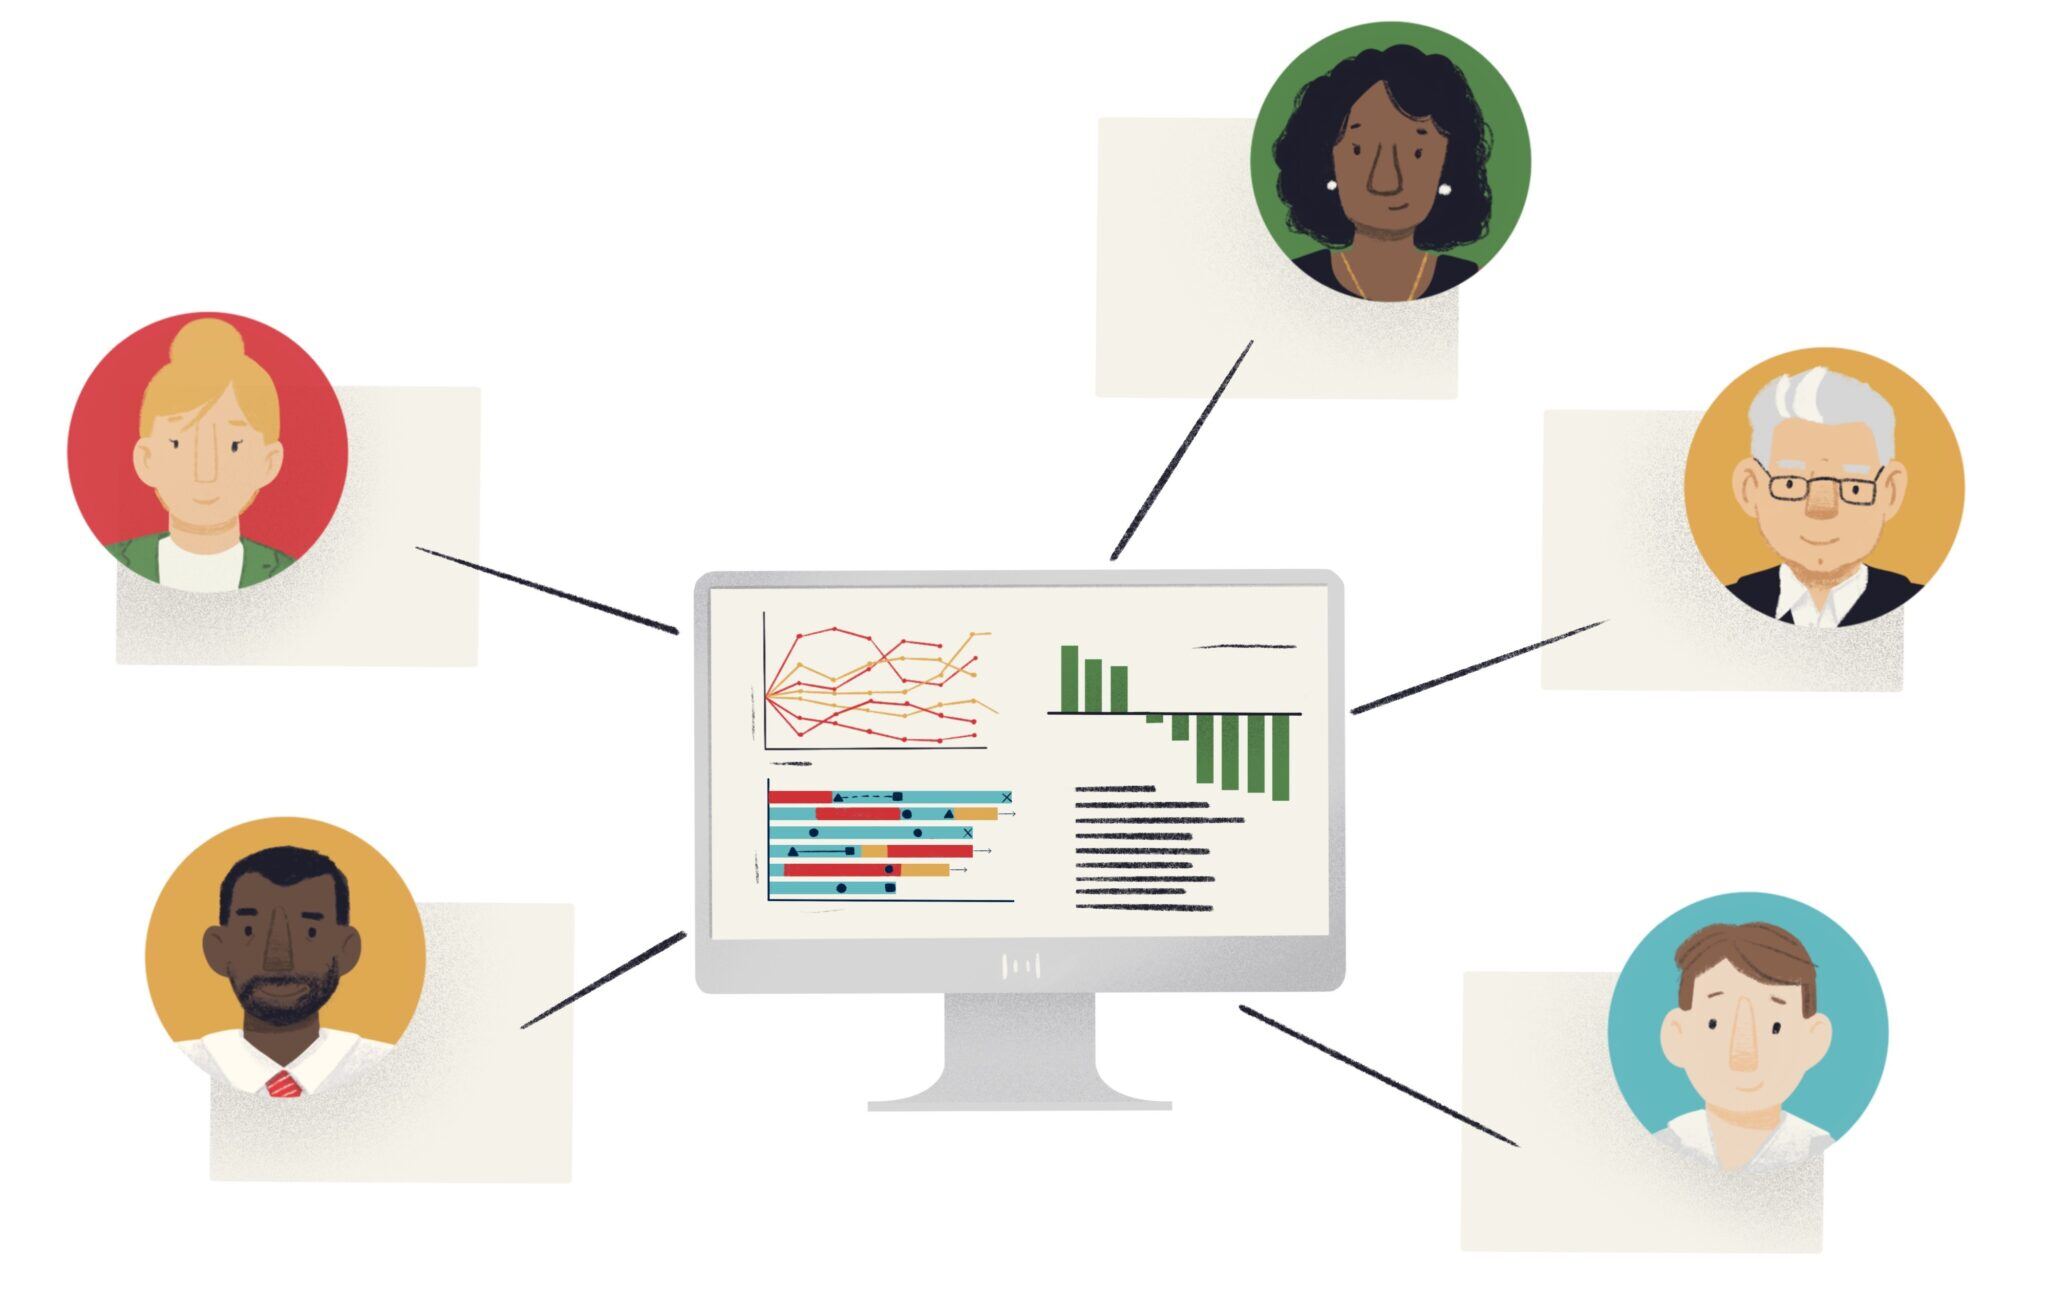
Smarter Medical Monitoring, From Screening to Submission
Recursis provides medical monitors and review teams with patient profiles and easy, real-time access to detailed patient data, ensuring clinical decisions are quicker, safer, and more informed.
Risk-Based Monitoring That’s Purpose-Built for Your Protocol
Automate Oncology Analytics from Enrollment to Endpoints
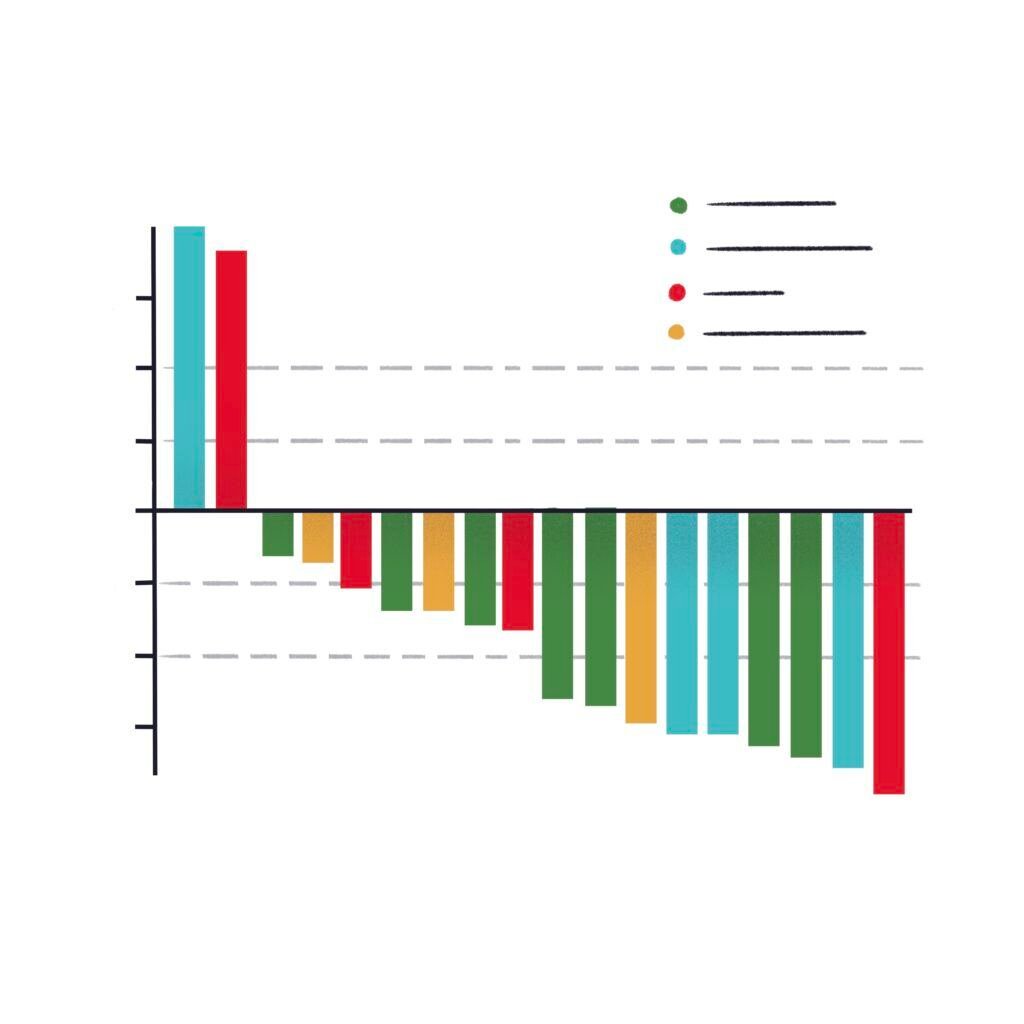
Recursis delivers automated oncology data workflows daily, linking prior regimens, biomarkers, tumor response, and survival endpoints in one continuous view. From RECIST automation to daily PFS/OS visualizations, we help study teams clean, align, and analyze oncology data with confidence.
Integrated Analytics Across Your Entire Clinical Ecosystem with Precision
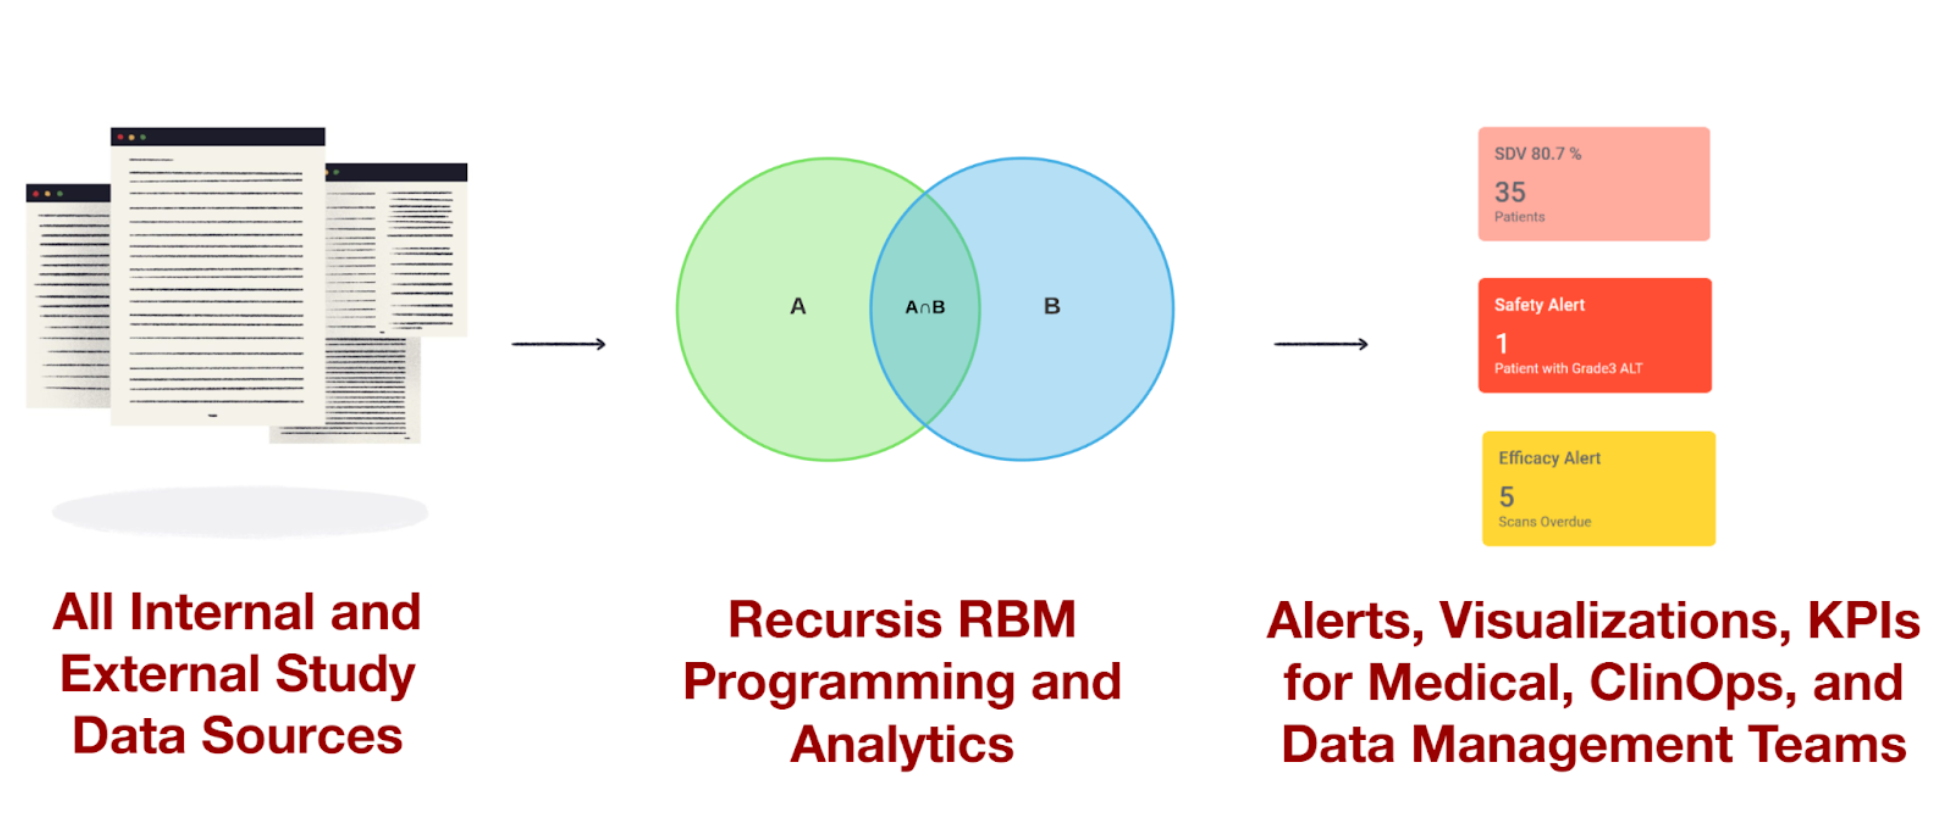
Recursis enhances the systems you already use—turning raw study data into clean, visual, and actionable insight. From inclusion tracking and efficacy analysis to safety grading and PK/PD modeling, our platform connects seamlessly with major EDCs and safety systems to power fast, reliable analytics at every stage of your trial.

What you get
Secure Data Transfers
You get secure file transfer, data storage, and deep GxP know-how to support data transfer agreements between organizations and CROs in validated environments.

Integration Expertise
Decades of expertise and experience connection end users with great data visualization platforms from major commercial analytics vendors. We deliver projects with impact, agility, and provide fast results to end users that they can see and use.

Scientific Visualization Templates
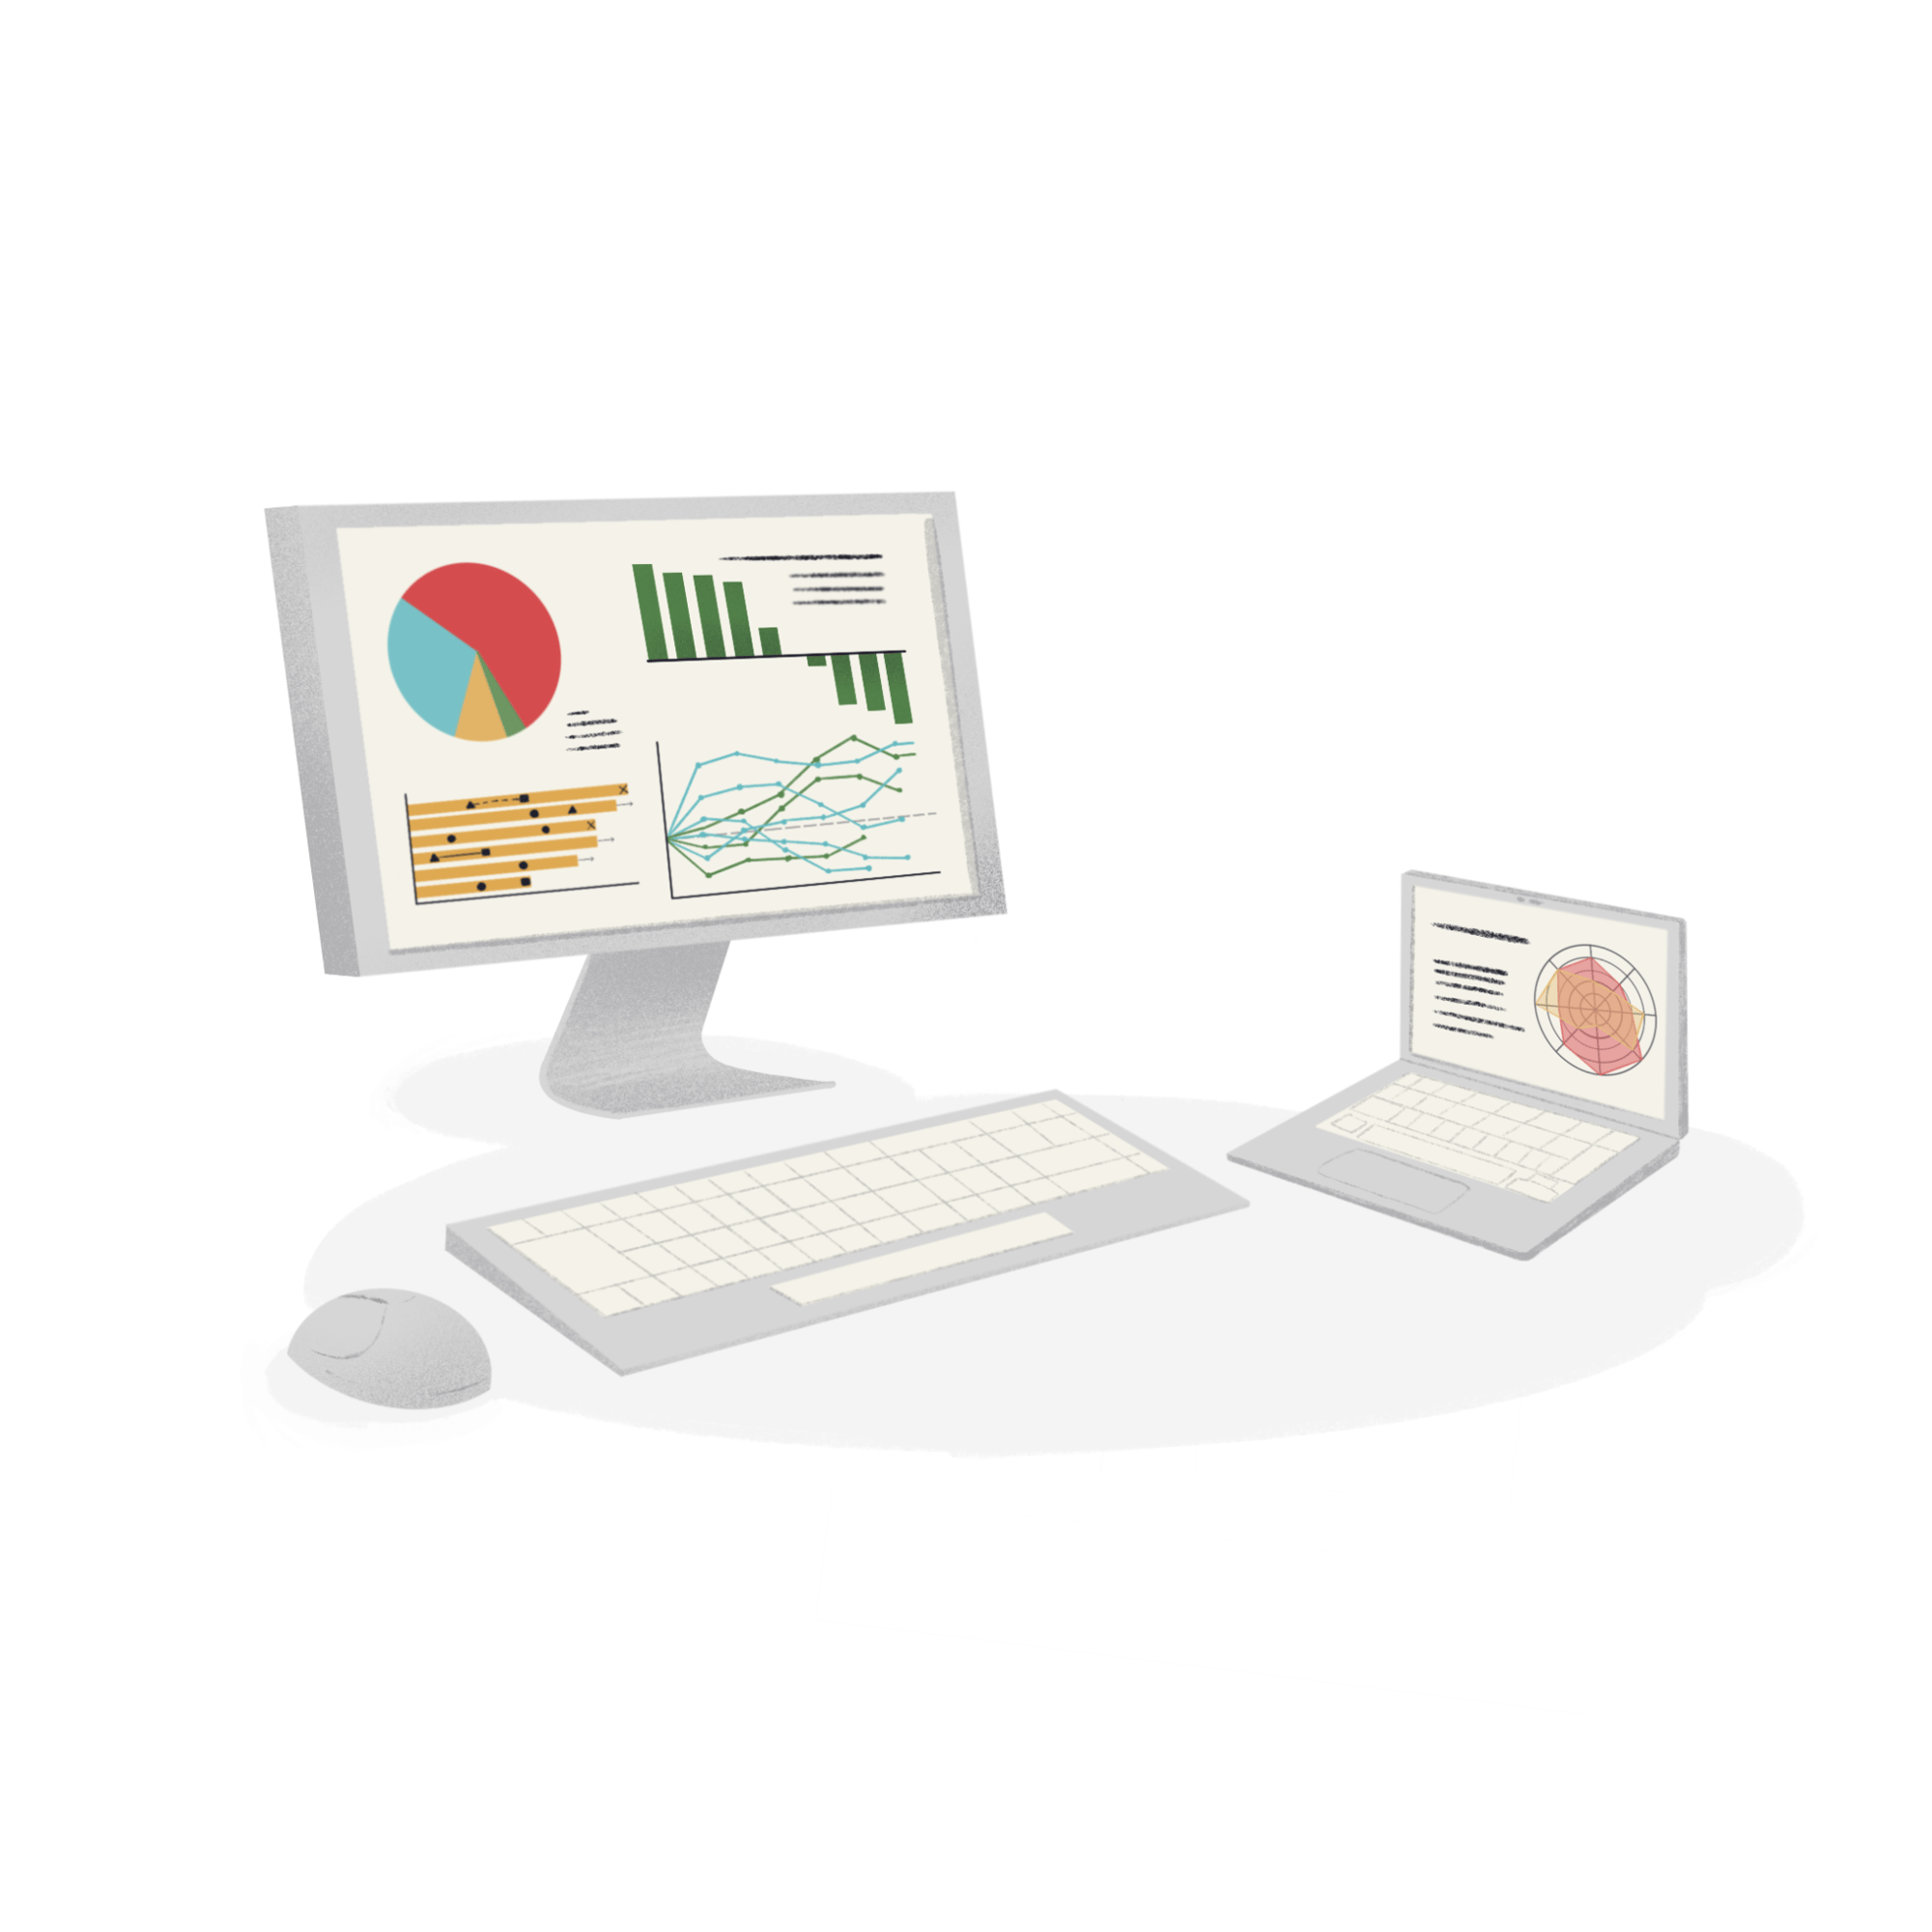
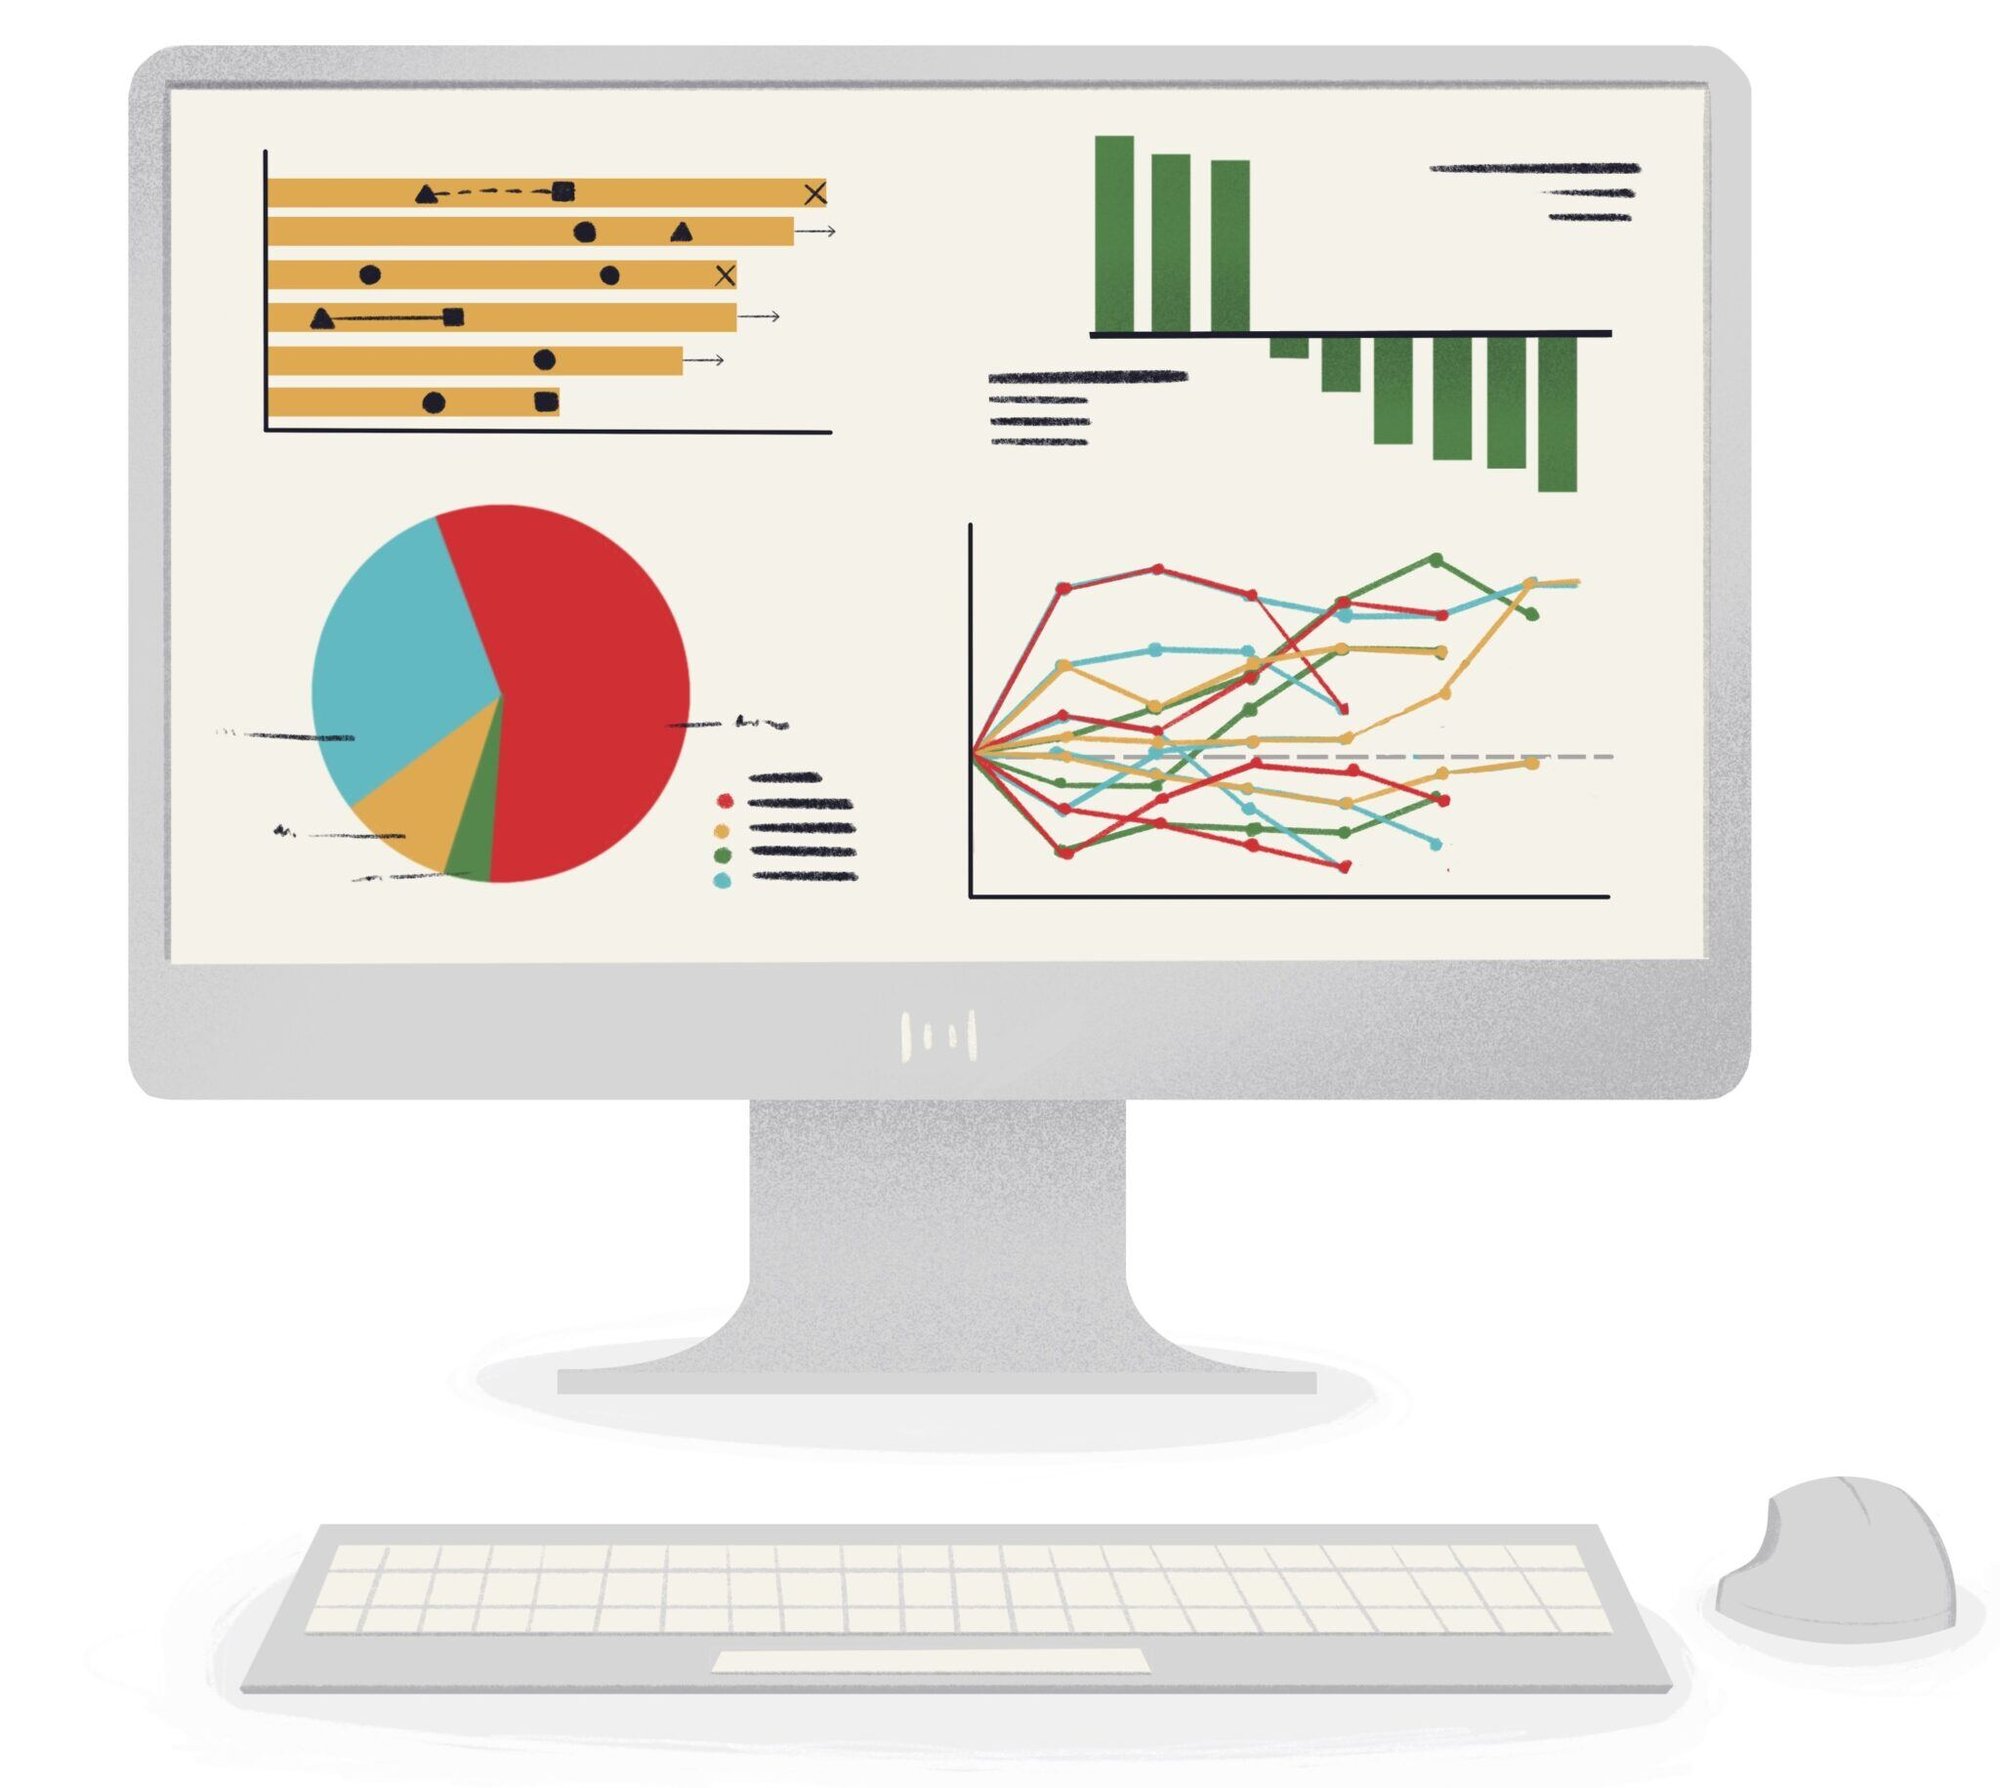
Automated data visualization templates customized for disease areas including cardiovascular, oncology, immunology, hepatology, and more. Study specific calculations to help you monitor outcomes, check the accuracy and completeness of your data quickly. Study dashboards templates customized for your experimental design, key end points, and KxIs. We do this so your scientists can focus on science.
How we work with your teams

Advisory Services
We help you assess your organization’s readiness for analytics so you don’t waste money on software or tools you’re not prepared to use.
Our consulting is hands-on and we work directly with your teams and your data to deliver practical recommendations, honest feedback, and working prototypes that support real decision-making.
Project Solutions
When you’re ready to move, we deliver fast, high-impact solutions backed by decades of experience.
From data visualization and pipelining to SQL, warehousing, EDC analytics, and cloud platforms, we bring certified expertise without unnecessary complexity.
Our focus is on agility, clarity, and results your users can see.

Managed Services
Recursis is a strategic partner for scaling and sustaining your data and analytics operations.
We support back-office data workflows, platform administration, user training, and cloud migrations.
We also provide interim leadership to guide your informatics strategy. Whether you're a growing biotech or a global sponsor, we plug in fast and stay aligned with your business goals.
